Introducing the OzFinn ETF Comparison tool
The ETF cheatsheet of Australia.
An ETF comparison tool to help you build your ETF portfolio and make informed investment decisions.
I've spent more time than I'd like to admit comparing ASX ETFs - opening issuer PDFs, copying numbers into a spreadsheet, and still walking away unsure whether I was actually comparing like with like. So I built the thing I wished existed: a single page that puts every fund side by side, no sign-up, no fluff. And the notion of a "tax-drag estimate" built in. Something that a lot of people miss or skip.
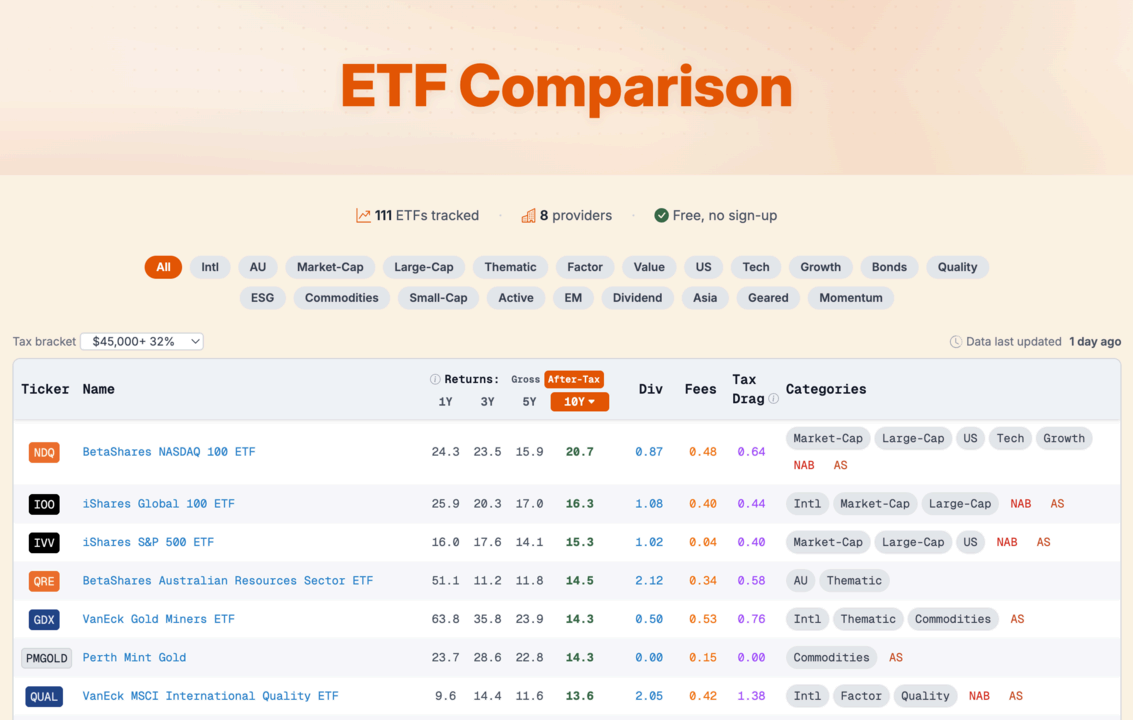
OzFinn now tracks 111 ETFs across 8 providers, and more are to be added. If I've missed something that you follow or invest in please ping me on reddit r/OzFinn.
Charlie Munger's line has been rattling around my head the whole time I built this: "Show me the incentive and I'll show you the outcome." A fund issuer's marketing is incentivised to show you a flattering headline return. This tool is incentivised to show you the number that actually lands in your account. Those are not the same number - and the gap between them is where most of the interesting stuff lives.
Here's what I'm most happy with.
Tax Drag
This is the feature I'm proudest of, because it's the one nobody else bothers to estimate. Every ETF carries a hidden cost that never shows up in the MER: the tax you pay along the way on distributions and on capital gains the fund realises through turnover.
The tool estimates that drag for your tax bracket. Pick your income band at the top of the table, and the Tax Drag column updates to reflect what the fund's dividends, franking credits, and turnover are likely to cost you. A high-yield or high-turnover fund can quietly hand back a chunk of its return to the ATO every year - and now you can see roughly how much before you buy.
Sort by After-Tax return
Flip the returns toggle from Gross to After-Tax and every period is recalculated net of the estimated drag for your bracket.
Tip for long-term investors: select your tax bracket, switch to After-Tax, and sort by 10Y. The funds that float to the top of that list are the ones that have compounded efficiently after the taxman's cut - often a very different ranking than the gross one. It's a fast way to surface a shortlist of genuine candidates.
Return Ranking - consistency, not luck
On each fund's own page (e.g. the S&P 500 / IVV page), every return period now carries a rank - where that fund sits against every other ETF in the database over 1Y, 3Y, 5Y, and 10Y.
This is a small inversion trick I find useful. Instead of asking "has this fund done well?" - which a single good year can flatter - ask the opposite: "would this fund's ranking embarrass me over the long run?" A fund that's #3 over ten years but #46 over one year is telling you something very different from one that's #2 this year and nowhere over a decade. Recent success and durable quality look identical on a one-year chart. The rankings pull them apart.
Plain-English notes on every fund
Each fund page also carries three short sections written for humans, not for a compliance department: Strengths, Things to watch, and Good to know. They're meant to be the thirty-second read that flags the one thing you might otherwise miss - a cheaper alternative, a yield that's really a growth story, a turnover number that should give you pause.
A standing reminder, and one I hold myself to: none of this is financial advice. The returns and tax-drag figures are estimates built on historical data, and history is not a promise. Treat the tool as a way to ask better questions and narrow the field - then verify anything that matters against the issuer's own factsheet before you act. At the bottom of each fund's page you will find all relevant links to help you do that.
Have a look: ozfinn.com.au/etf. If you spot something wrong or missing, tell me - that's how it gets better.